Progress Tracker
Data Visualization Tool
Progress Tracker began as my way of learning Python and Streamlit while exploring something that mattered to me: how children’s growth can be recorded and shared clearly. Beyond milestone logs and charts, this project highlights my ability to bridge design and code, and to collaborate with developers through a shared language.
Project Contribution
01
Python logic and data handling
02
CLI and Streamlit app structure
03
Data visualization and chart design
04
User flow and interaction logic
05
Iterative testing and refinement
Context &
learning focus
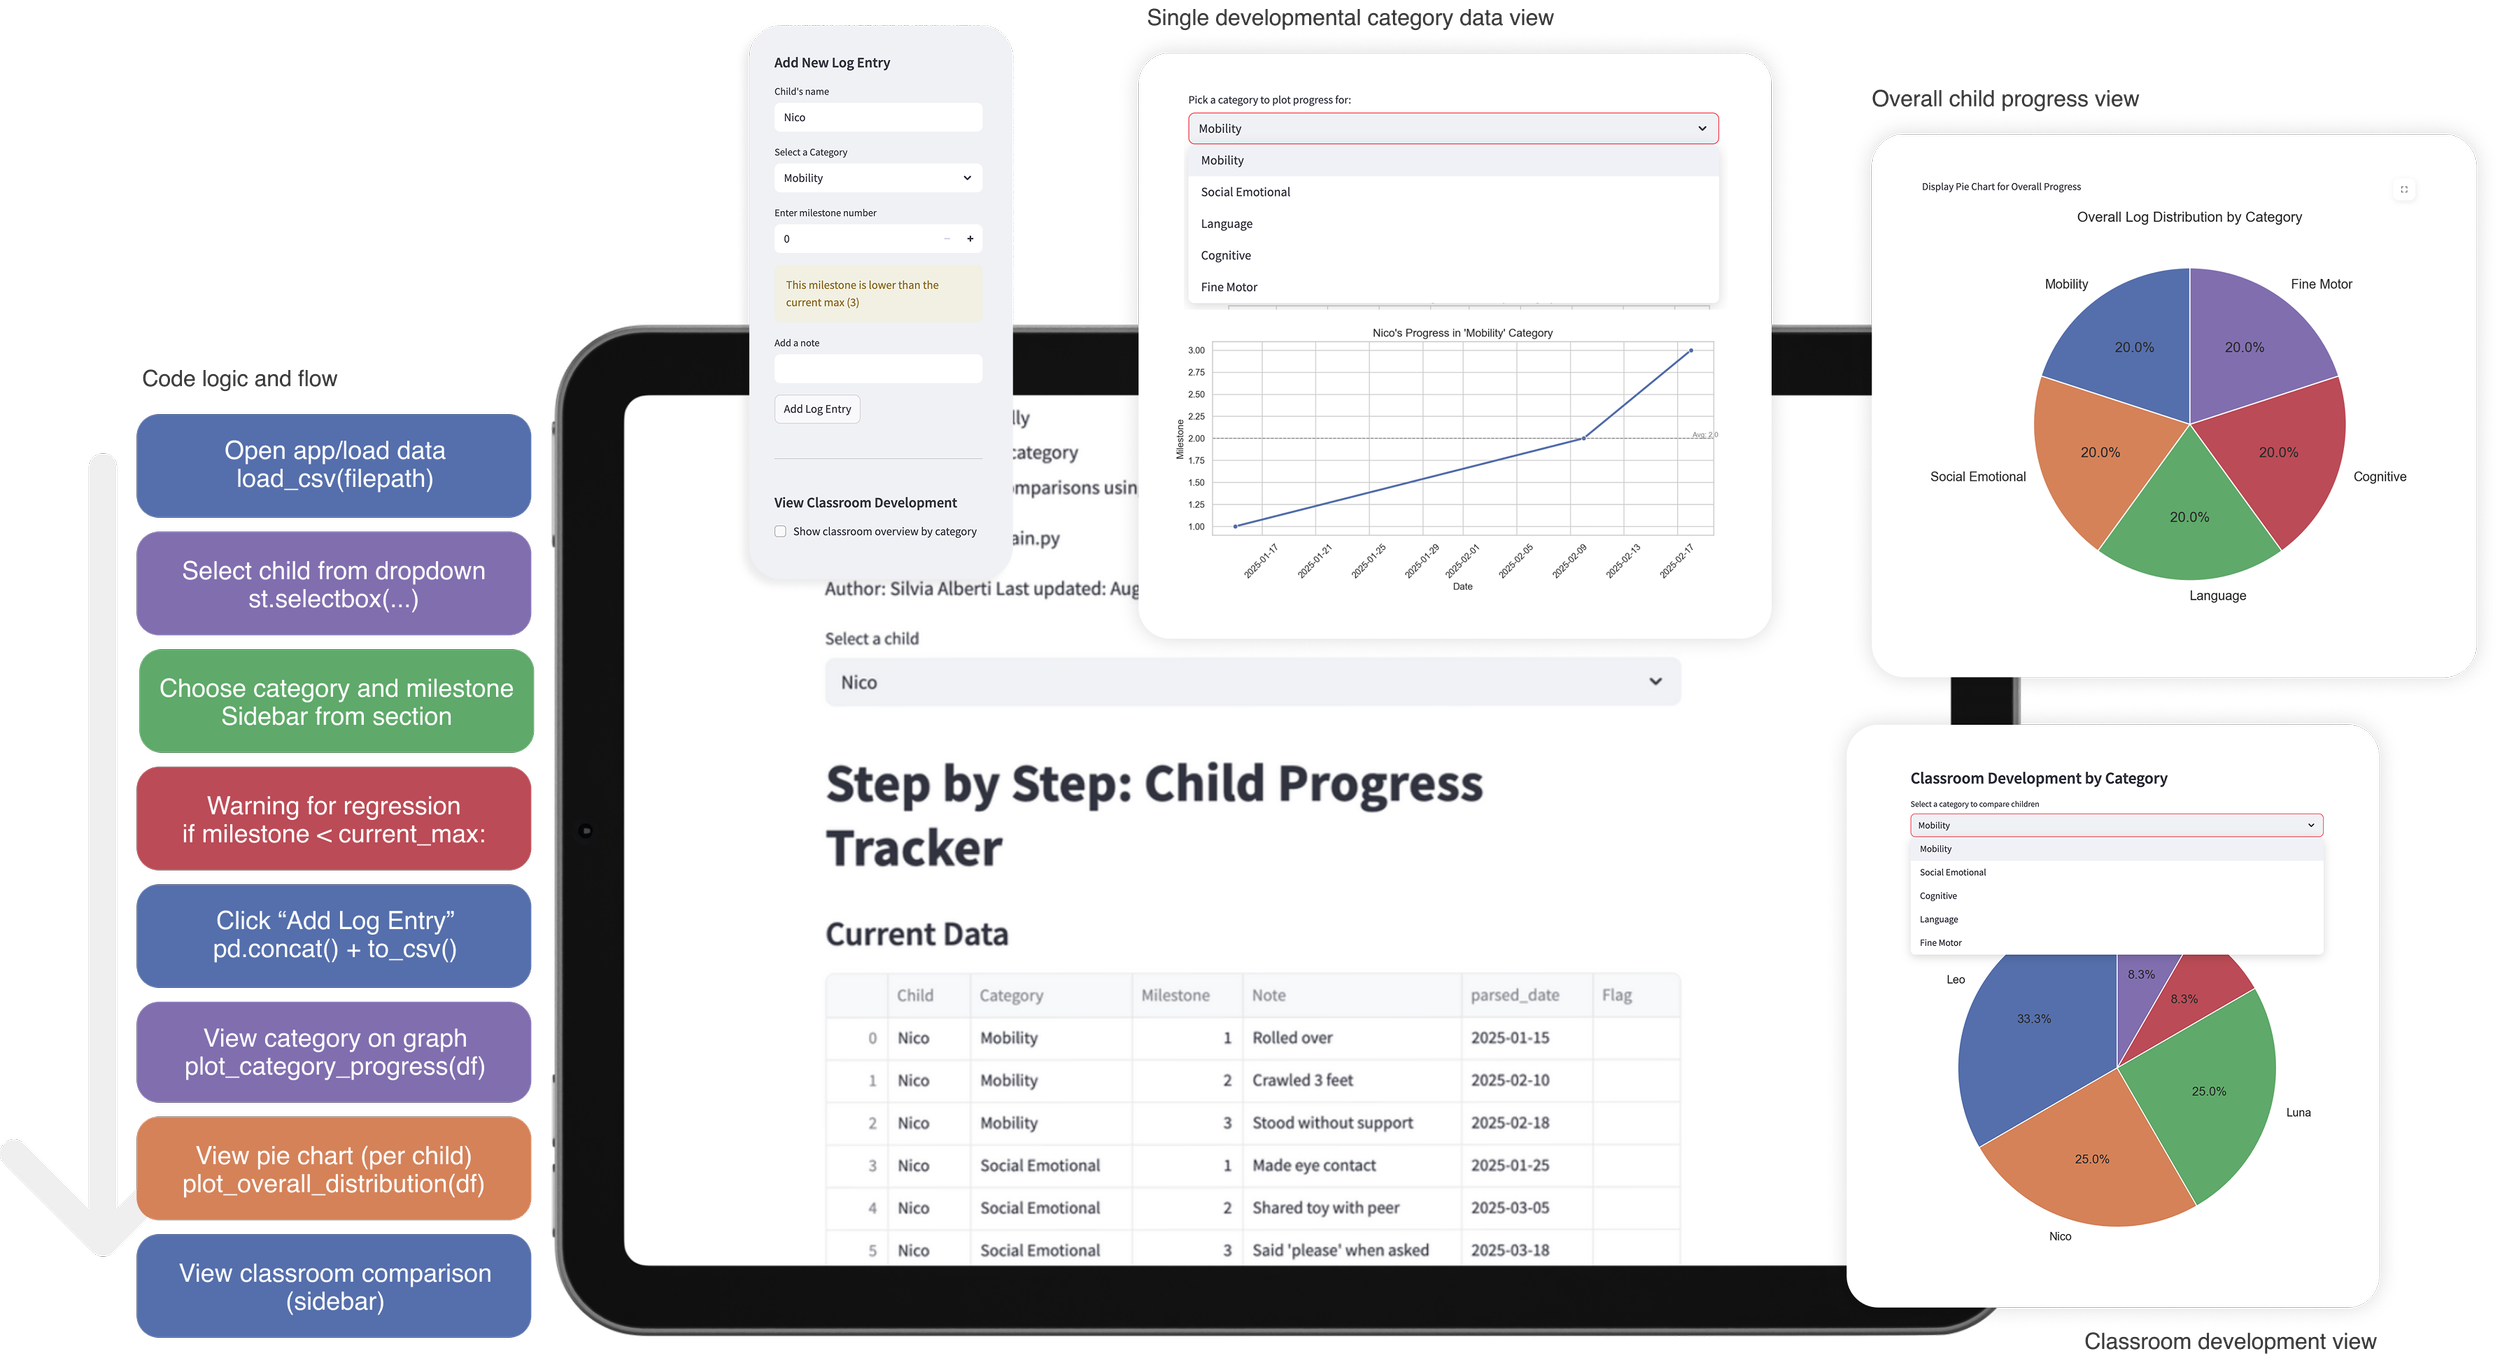
The project was developed as a self-directed learning exercise to build fluency in Python while maintaining a design-driven mindset. I focused on understanding how data moves through a system, from input and validation to visualization and interpretation.
By grounding the project in a real use case, the learning process stayed connected to clarity and usability, rather than abstraction.
Interaction
through data
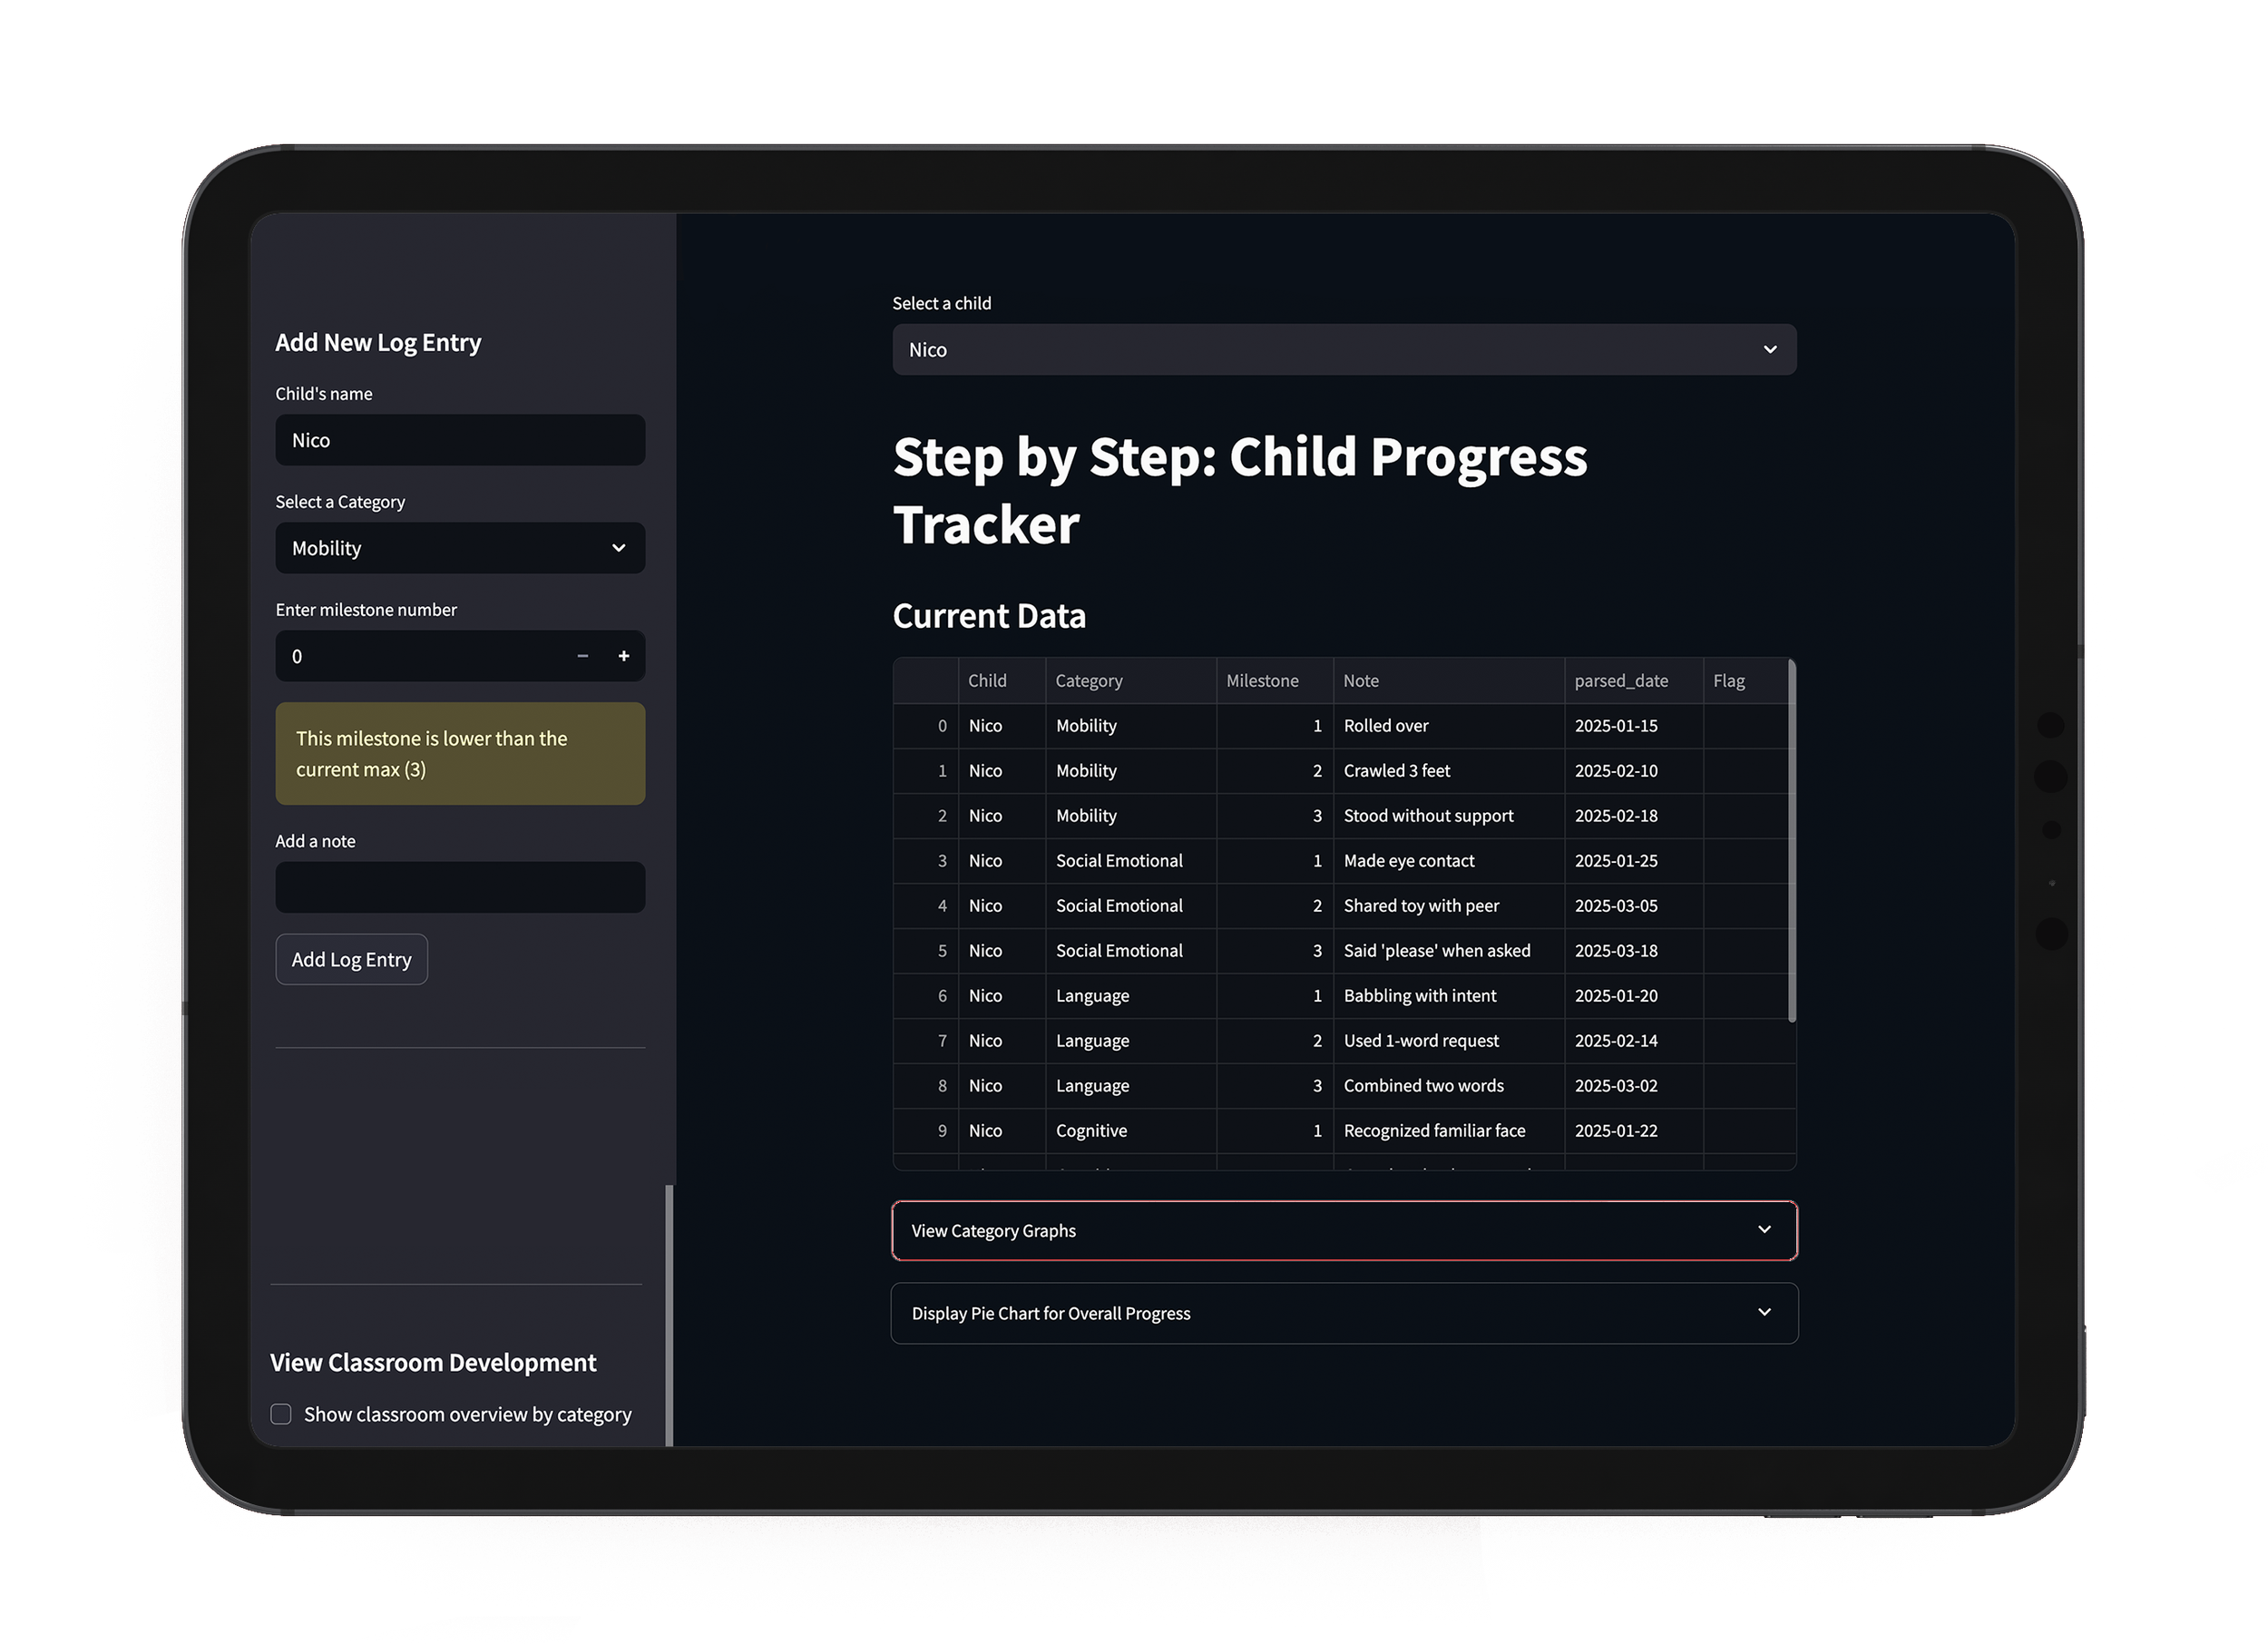
Users can log developmental milestones, view progress over time by category, and explore overall distributions through line charts and pie charts. The interface prioritizes legibility and simple decision-making, allowing patterns to emerge without overwhelming the user.
Warnings and feedback are built into the flow to encourage careful data entry and reflection, reinforcing accuracy over speed.
Designing While Learning
Progress Tracker reflects how I approach new technical skills: by pairing experimentation with intention. The project is not positioned as a finished product, but as a working system that demonstrates my ability to bridge design thinking and code.
It marks an early step in integrating programming into my practice, shaping how I collaborate with developers and think about systems beyond the visual layer.